Making tables in Google Sheets or Microsoft Excel might seem odd since both tools already offer a grid that resembles a table. But, having boxes with blank spaces inside isn’t what a table is all about. The data can still be converted into a well-formatted table to make it more comprehensive and readable. So, knowing how to make a table in Google Sheets in the right manner is great.
A datasheet can be formatted on various levels to build a table that is visually appealing and easy to read. The clarity that a table offers comes in handy while making data-driven decisions for a business. For better data analysis, you can also choose to make a pivot table in Google Sheets.
How To Make A Table In Google Sheets: Make Your Data Attractive
Making a table is not a mandatory thing to do in a Google Sheet, but you may have to make one in a Google doc or Google slide if necessary. There is no denying that data arranged in a tabular format is impressive when you are presenting it to an audience. That being said, let’s see the ways to make a table in a Google spreadsheet.
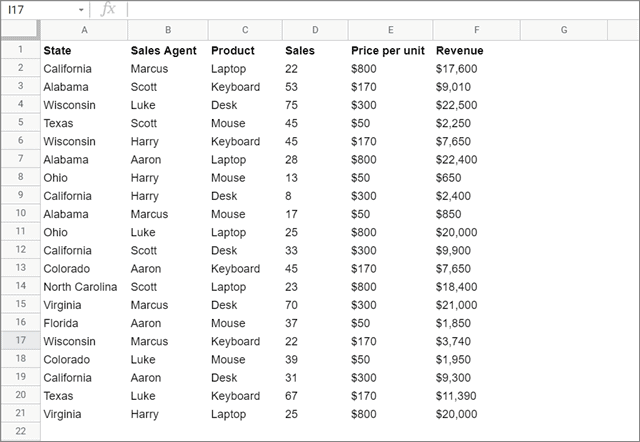
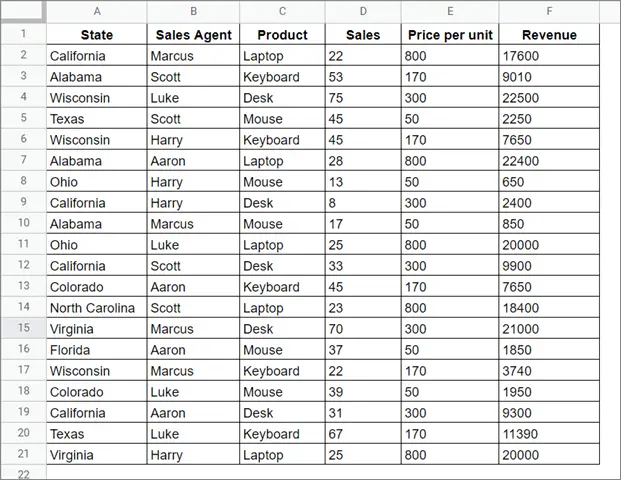
Let’s consider the sales datasheet to understand the basics. We will apply appropriate formatting to convert this tabular data into a simple table.
How To Apply Borders To The Table
Table border is an important table element when making a table in a new spreadsheet or a Google Docs document. First, select the dataset that you wish to convert in a Google Sheets table. Make sure you select data from the top-left cell.
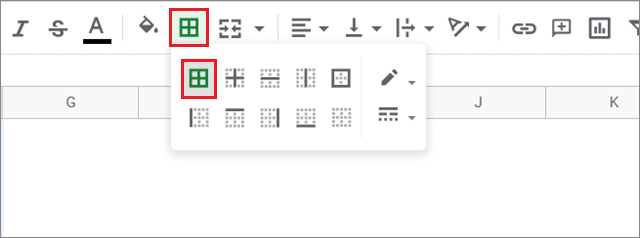
Go to the toolbar in Google Sheets and click on the Borders option. Then, click on the All borders option.
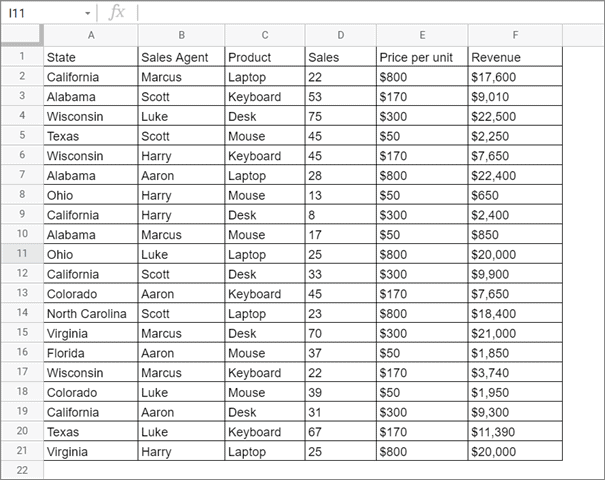
You can see that your data has gained a tabular look with a cell border. To make an awesome table, this is one of the most commonly used properties.
You can choose to change the table cell border color if you wish to decorate your table. All you need to do is click on the Pencil icon in the Borders menu and choose any color of your choice from the color palette.
Edit The Header Rows
Now, the column header cells need some editing. Let’s see how we can polish the center column headings in the Google document.
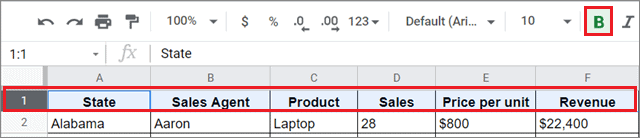
First and foremost, the header row needs to be distinguishable because all header cells act as a column description. To embolden it, select the entire row and click on the Bold (B) icon. You can also use the Ctrl + B shortcut to embolden data in a spreadsheet.
Now, you need to edit the position of all the header cells. You can choose any option from the Align menu on the toolbar to adjust the positioning. Here, we have used the center alignment.
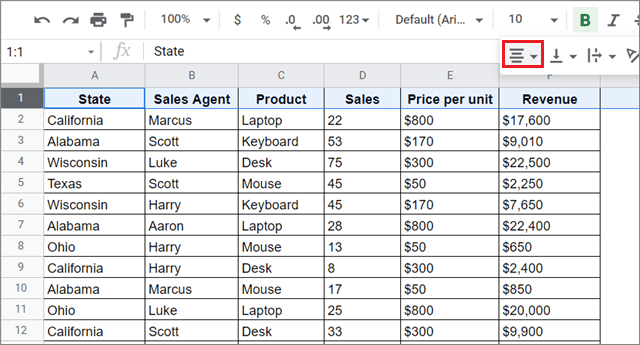
While aligning the header row, make sure the table alignment is uniform. It’s a bad practice to use different alignments in the header row.
You can also use a different color so that the header row clearly stands out in the datasheet. Users can either color the row or the text data. All you need to do is use the Text custom colors and Fill color options in the toolbar.
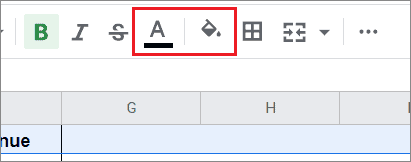
When you click on any of the options, you will be presented with a color palette. Choose a color of your choice to change the look of the header row. You can also use the format option and create custom colors option for the headings.
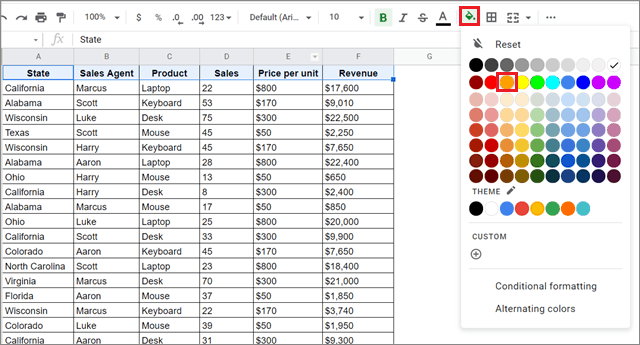
Here, we have opted for the Fill color option and selected the Orange color.
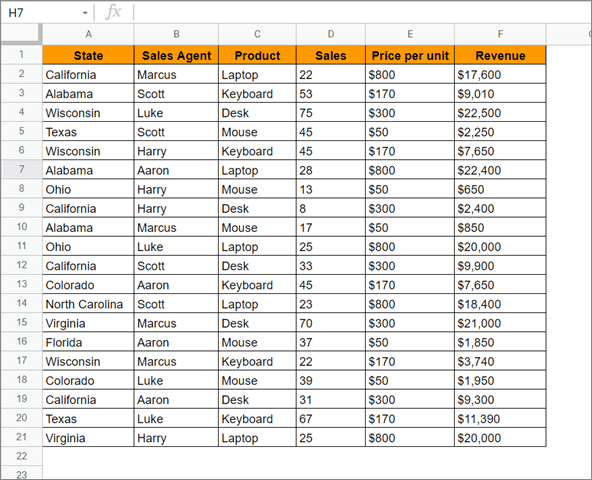
When you choose the Fill color option, this is how the background color of your header row will look like.
If you want to reverse this action for the cell background color, you can click on the Undo button or choose the white color from the Fill color palette.
Format The Numbers
To format numbers, let’s consider an example. Notice how the ‘$’ sign is gone from the Sales and Revenue columns. Also, there is no comma to separate the figures for better readability.
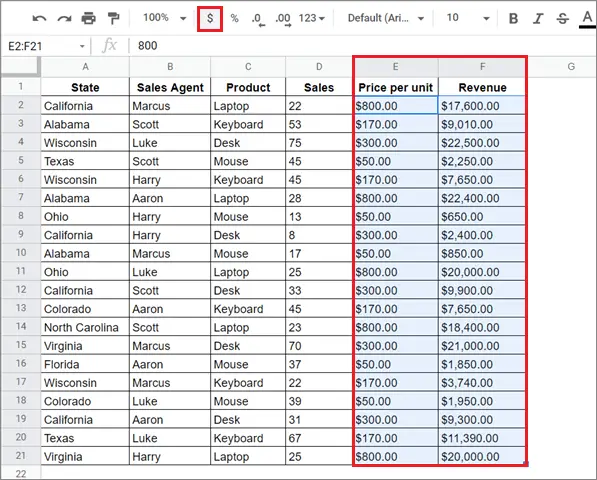
The first task is to format these numbers as a currency. So, select the columns that have numeric values.
To do this, click on the ‘$’ sign in the toolbar. This will add a dollar sign in front of the number, a decimal point, and two decimal numbers as shown in the image below. Also, the commas will be added automatically to improve the readability of the basic table.
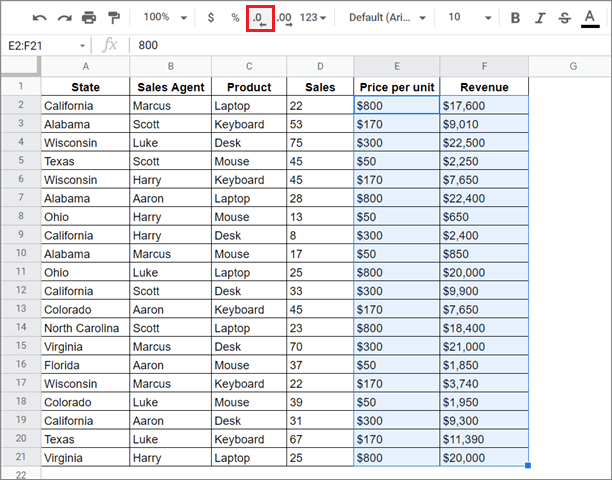
Now, suppose you want to increase or decrease the number of decimal digits in the Google Sheets table, you can do that too. Click on the decimal point icons as per your choice to increase or decrease the decimal digits. Here, we have decreased both decimal digits to enhance the readability.
Adjust Column Width And Row Height
When you are working on how to make a table in Google Sheets, your columns should be neatly spaced. Let’s see how we can do that quickly.
Place your cursor on the column line; you will see a horizontal line having arrows on both ends. Then, drag the cursor to change the size of the columns.
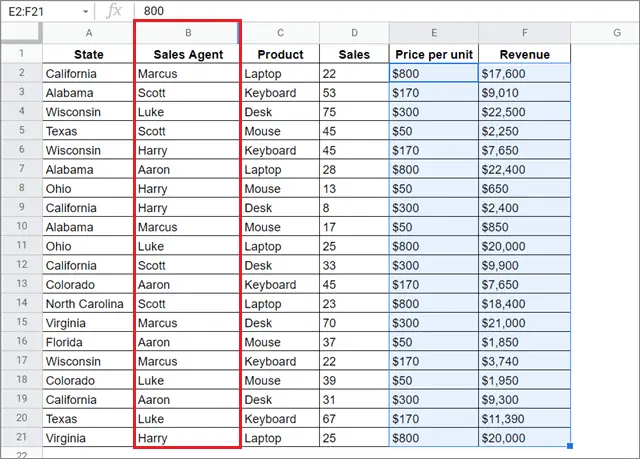
Here, we have increased the column width of the Sales Agent column. You can do the same process to increase or decrease the row height in a table.
Apply Alternate Colors
Until now, we have covered a large part of how to make a table in Google Sheets. Your table in Google Sheets should be ready by now, but let’s see what steps we can take to enhance it further.
We can choose to apply alternate colors to the Google Sheets table to make it look more attractive.
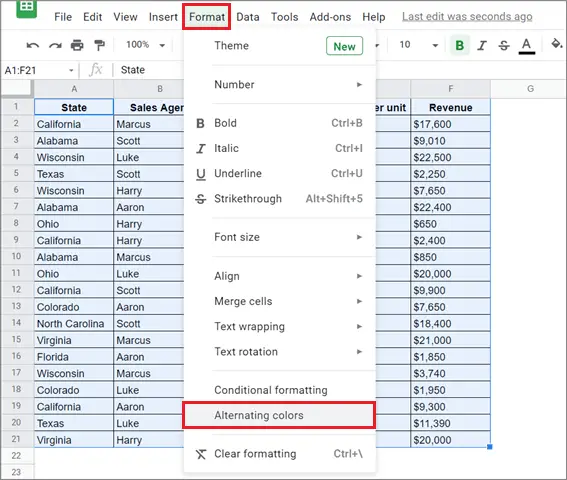
To begin with, select the entire table and click on the Format menu in the menu bar. Then, choose Alternating colors from the drop-down list of options.
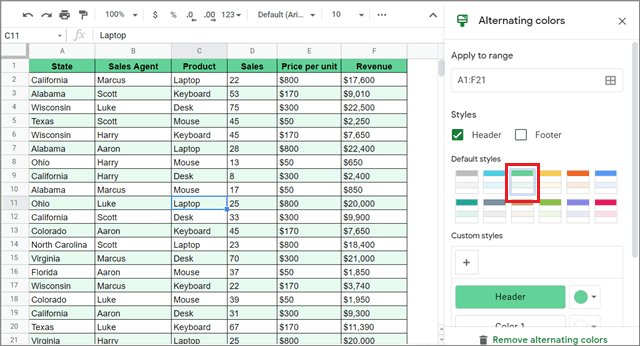
You will see that a sidebar appears on the right side. Choose a cell color combination for your table in Google Sheets.
How To Sort The Data
Many times, we need to sort the data in our table in a proper ascending or descending order. We can use the Sort range option and apply this setting in our Google Sheets table.
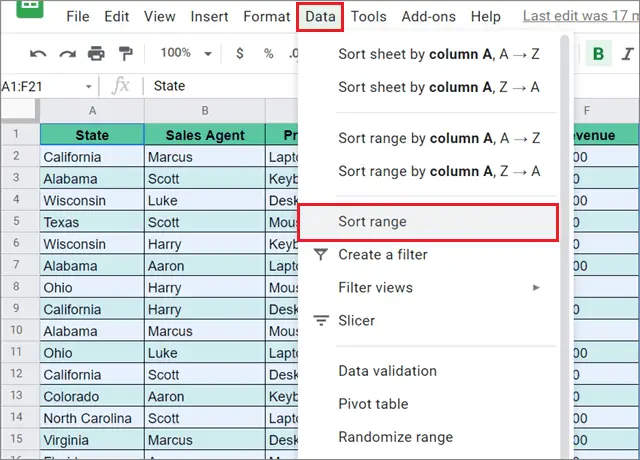
Select the entire table and click on the Data tab in the menu bar. Choose Sort range from the drop-down menu.
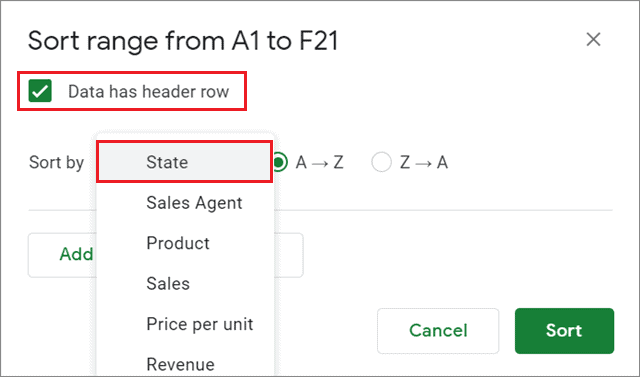
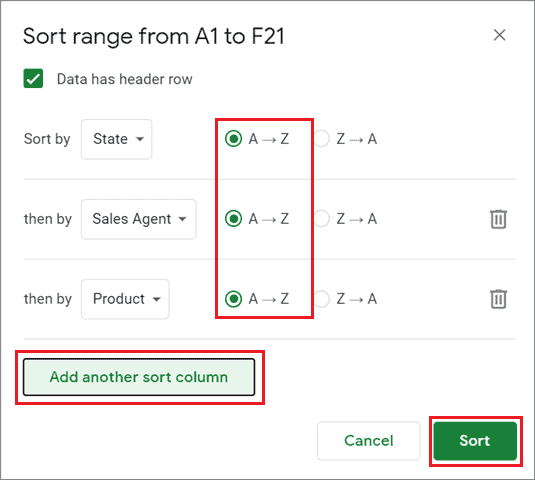
A dialog box will appear after you select this option. Check the ‘Data has header row’ checkbox. This will allow you to sort data based on the column names easily.
Now, choose any column in the Sort by section. Here, we have selected the State column.
If you wish to add an additional column for sorting, just click on the ‘Add another sort column’ button to do so. Then, choose the order for each column. Here, we have selected the ascending order for all the columns.
Click on Sort after you are done adding the sorting columns.
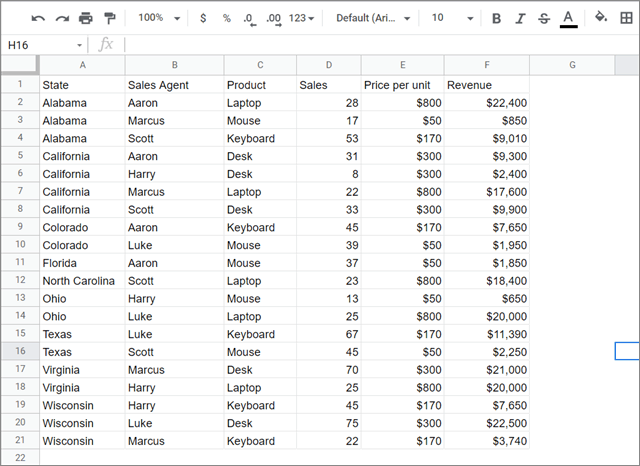
Now, take a look at how the table looks. The Sort feature has sorted the table first according to the State column, then the Sales Agent column, and then the Product column. That’s all you need to know about sorting in Google Sheets table.
How To Highlight High Or Low Values
When it comes to numerical data, we are always comparing values with each other. If you wish to know which value is high or low based on a certain condition, you can opt for conditional formatting in Google Sheets. Knowing how to format data based on conditions will give you a detailed insight into the data and help you make correct decisions.
How To Delete The Formatting In A Table
If you wish to remove all the formatting from your table in Google Sheets, you can do so with a few simple steps.
To begin with, select the standard table cells in the spreadsheet. Then, click on the Format menu and select Clear formatting from the list of options.
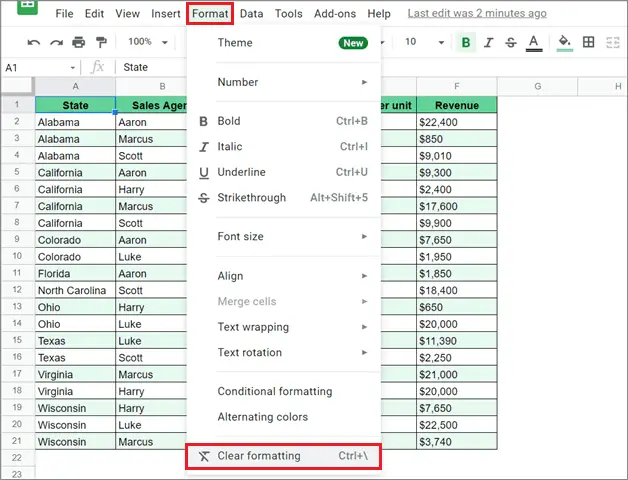
You can also use the Ctrl + / keyboard shortcut to clear the formatting. This is how the standard table will look once the formatting is cleared. If you wish to delete table content entirely, just select all the table cells and press the Delete button on the keyboard.
That’s all about how to make a table in Google Sheets. You can create any number of tables for better visualization of data. You can format complex tables in the manner mentioned in this article, and then use formulas like VLOOKUP in Google Sheets to extract meaningful data. You can also use this method for data validation and creating a dropdown menu.
Conclusion
We have seen the different parameters that can help us create, edit, and arrange tabular data ranges in a table. Having a table is especially important if you are presenting data to your colleagues in presentations. Having data in tables is a great sign of professionalism and always goes down well with a corporate audience. Hence, it is essential to know about the basics of how to make a table in Google Sheets.
Also, data in tables is very easy to understand. Collaboration is a breeze when working on data tables since every user can navigate easily and understand the changes made throughout the table. Apart from Sheets, users can create a Google Docs table or a Google Slides table. However, you cannot use a Google form to create a table.
FAQs
Can you create a table in Google Sheets?
Yes, you can create a table in Google Sheets.
Can you make a table in the Google Sheets app?
It is possible to make a table in the Google Sheets app, but it is not very convenient given the smaller view. Hence, making it on a PC is the better choice.
How do you create a data table?
You can create a data table by using formatting options like conditional formatting, borders, fonts, alignment options, and much more.


